LIVE SYSTEM
ISMAIL ROGERS-WRIGHT
Builds. Ships. Operates.
Data & AI professional who builds production systems, manages real operations, and ships results. Full-stack capability from Python to Docker.
I Build
Full-stack AI systems from scratch. Python → TypeScript → Docker. If I can't ship it, I don't claim it.
I Operate
Managed a 3PL operations floor. I know what it means to keep something running under real pressure.
I Deliver
4am wake-up, head-down execution. The work gets done. The systems stay running.
⚡ EXPERIENCE
Data Analyst — Operations Analysis
3.5 years- ▸Built automated reporting systems eliminating manual reconciliation
- ▸Developed dashboards identifying $300K+ in cost-saving opportunities
- ▸Created KPI frameworks for real-time operational visibility
- ▸Designed cross-functional analytics across underwriting, claims, and ops
3PL Operations Supervisor
2+ years- ▸Led warehouse operations with real-time delivery and KPI management
- ▸Reduced inventory variance 42% through process correction
- ▸Built reporting automation eliminating manual reconciliation
- ▸Managed cross-functional execution across warehouse, transport, and client services
⚙️ SKILLS & TECHNOLOGIES
Data Engineering
Python (Pandas, NumPy), SQL, ETL, Data Modeling, Pipeline Automation
AI & ML
LLM Integration, RAG Pipelines, PyTorch, scikit-learn, NLP, Agent Systems
Analytics & BI
Dashboards, KPI Design, Performance Reporting, Cross-Functional Insights
Engineering
TypeScript, Next.js, REST APIs, Docker, CI/CD, Version Control
Operations
3PL Logistics, Team Supervision, Workflow Optimization, KPI Tracking
Mindset
4am Deep Work, First Principles, Production-First, Continuous Delivery
🎓 EDUCATION
California State University, Fullerton
Communications — Completed Coursework
Intellectual canon: Robert Greene, Sun Tzu, James Clear, Stephen Covey, OSHO, Thich Nhat Hanh. Practical skill development through hands-on building — every project on this portfolio is deployed and running.
Lagos Logistics Claims Report
Claims Analysis · 3-Year Review · Tableau Dashboard
Comprehensive analysis of three years of logistics shipment records and carrier damage claims. Built a multi-page Tableau dashboard to identify loss patterns, isolate root causes, and quantify actionable savings opportunities.
📊 TABLEAU DASHBOARD
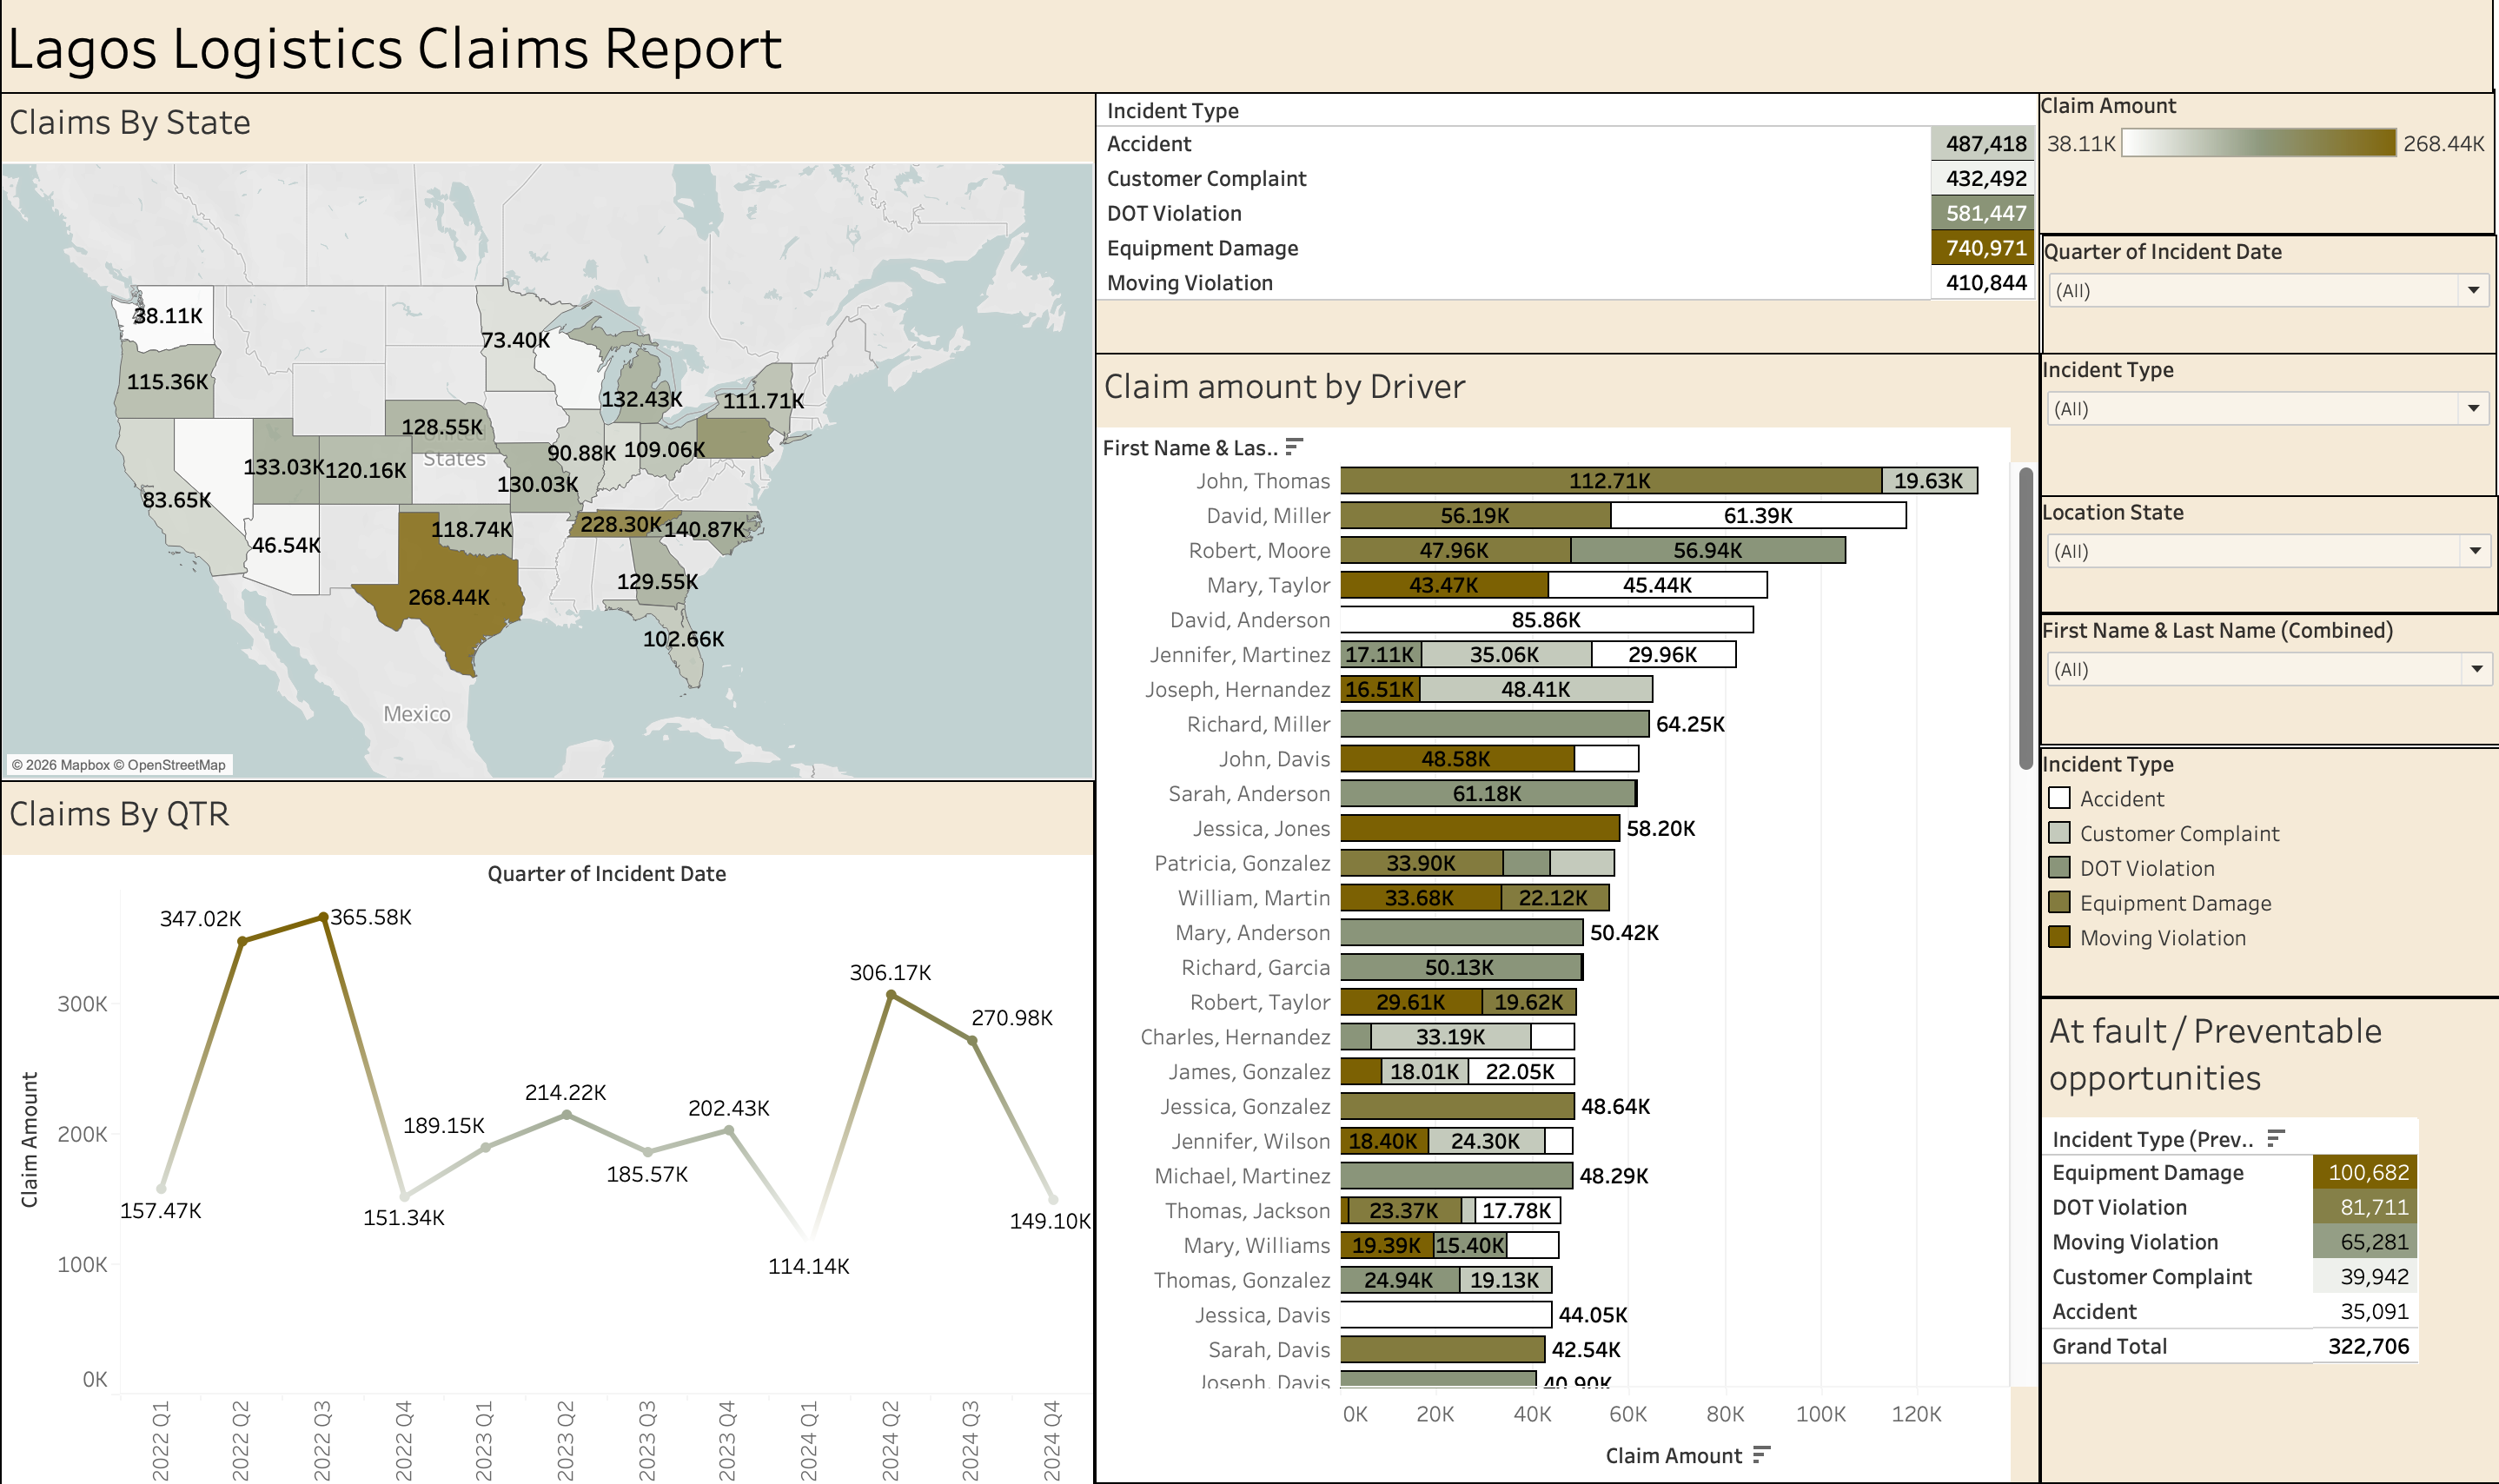
1. Claims By State
A high-level geographic analysis reveals that the majority of claims originate from the southern and eastern regions of the United States. Texas is the clear leader in total claim amounts, followed closely by Tennessee and Pennsylvania.
The average claim amount per active state is approximately $120K. Texas alone exceeds this average by more than double, signaling a significant concentration of risk in that state.
2. Claim Trends Throughout the Years
Over the three-year analysis period, claim activity consistently peaked during Q2 and Q3 of each year. The highest claim years were 2022 and 2024. Taking a seasonal view, several potential drivers emerge:
- ▸Weather conditions — harsh winter and spring weather
- ▸DOT violations — seasonal spikes in inspections or enforcement
- ▸Traffic patterns — higher freight volumes during spring/summer
- ▸Moving violations — driver behavior correlating with seasonal pressures
- ▸Customer complaints — operational strain during peak periods
3. Claims By Incident Type
The majority of claim costs stem from Equipment Damage. However, equipment damage is typically an effect of an underlying event, not a root cause itself. Since other incident types show no strong direct correlation with equipment damage, we can reasonably assume that at least a portion of equipment damage-related claims results from accidents that occurred but were not coded as such in isolation.
Beyond equipment damage, the next highest claims expenses include DOT violations, moving violations, and cargo-related losses — each requiring distinct intervention strategies.
4. Claim Types by Driver & Incident Type
DOT violations are relatively evenly distributed across the driver pool, suggesting broad, systemic exposure rather than a small group of repeat offenders. However, a different pattern emerges with equipment damage claims — several drivers, most notably John Thomas, carry disproportionately high equipment damage charges compared to their peers.
This raises two critical questions:
- At-fault status — in which incidents was the company or driver determined to be at fault?
- Preventability — of those at-fault incidents, how many could have been reasonably avoided?
5. Opportunities for Big Savings
The reality of logistics operations is that claims can never be fully eliminated. However, the subset of claims where the company was both at fault and the incident was preventable represents the single greatest opportunity for loss reduction — over $300K in identified savings.
By examining the specific incident types, driver behaviors, and operational conditions that led to these at-fault, preventable events, we can implement targeted measures to reduce overall exposure across the organization.
DATA SOURCES & PREPARATION
- ▸3 years of internal shipment records (Excel/CSV)
- ▸Carrier damage reports and insurance filings
- ▸SQL joins across claims, shipment, and driver tables
- ▸Data cleaning: standardized incident categories, date normalization
ANALYSIS APPROACH
- ▸Geographic aggregation by state and region
- ▸Seasonal trend analysis with quarter-over-quarter comparison
- ▸Incident type categorization and root cause inference
- ▸At-fault and preventability scoring for savings quantification
From Claims Data to Actionable Intelligence
This project demonstrates the full data analysis lifecycle: raw data → cleaning & structuring → exploratory analysis → visualization → actionable recommendations. The same approach powers every dashboard, pipeline, and decision tool Ismail builds — turning messy data into clear business outcomes.
Deal Underwriting Calculator
Bastion Equity Group · Dec 2024 · Excel, Financial Modeling
Standardized investment analysis model evaluating real estate properties across wholesale, flip, and long-term rental scenarios. Automated green/yellow/red outputs based on market comps and repair cost tiers — cutting deal evaluation time by 75%.
🧮 MODEL ARCHITECTURE
┌───────────────────────────────────────────────────────────┐
│               DEAL UNDERWRITING MODEL                        │
├─────────────────┬──────────────────┬────────────────────────┤
│ INPUTS          │  COMP ANALYSIS   │  OUTPUTS                │
├─────────────────┼──────────────────┼────────────────────────┤
│ AS-IS Valuation │  Price/sqft      │  Max Buy Offer          │
│ ARV (After     │  Market          │  Profit/Loss Projection │
│  Repair Value)  │  adjustments     │  Cash-on-Cash Return    │
│ Repair Cost     │  Comparable      │  Holding Cost Calc      │
│  Tiers          │  selection       │  Green/Yellow/Red Flag  │
│ Holding Period  │  Weighted avg    │  Scenario Comparison    │
└─────────────────┴──────────────────┴────────────────────────┘
METHODOLOGY
- ▸Comparable sales analysis with market-weight adjustments
- ▸Multi-scenario modeling (best/medium/aggressive repair costs)
- ▸Conditional flag system: green/yellow/red based on return thresholds
- ▸Holding cost calculation with time-value sensitivity
BUSINESS IMPACT
- ▸Evaluations dropped from 45 min to under 10 min per deal
- ▸Standardized deal language across 3 acquisition markets
- ▸Eliminated back-of-envelope guesswork from deal pipeline
- ▸Enabled rapid comparison across property types and scenarios
Logistics Claims Analysis Dashboard
Personal Project · Apr 2025 · Excel, SQL, Tableau
Analyzed 3 years of internal shipment records and carrier reports. Built a claims tracking dashboard in Excel, SQL, and Tableau that identified $300K in preventable incidentsout of $2.6M in total claims — delivering actionable recommendations that reduced future liability exposure.
From Underwriting to ML Pipelines
These models started in Excel. The same analytical thinking now powers Python-based ML pipelines, automated scoring systems, and AI agents. The tools scale up — the method stays the same: understand the data, build the model, ship the decision tool.
Additional Projects
Interactive Portfolio
FRONTENDThis site — live automated system with agent mascots, Q&A, and real-time pipeline data. Next.js, TypeScript, Docker.
Interactive Ship Log
ANALYTICSExcel dashboard tracking inbound/outbound shipment lifecycles. Reduced chargeback risk by 35%.
Application Tracking System
OPERATIONALState-machine pipeline tracking every stage from initial contact through offer.
Interactive Agent Boardroom
FRONTENDPixel-art visualization with roaming AI agents — custom simulation, pure CSS + React.
Ask Beavis & Butthead
Ask about Ismail's skills, experience, projects, or how to reach out. Personal questions prompt a phone call.
Talk About What You're Building
You've seen the system. Now talk to the person who built it. Email Ismail directly — no pitch, just a conversation about data problems worth solving.
ismailwright@gmail.com →Open to: Data Scientist · Data Engineer · AI Developer · BI Developer · Data Analyst · Operations Analyst
Ismail Rogers-Wright · Builds. Ships. Operates.